


Volume -
3 , - : 679-686 |
Back to browse issues page



Download citation:
BibTeX | RIS | EndNote | Medlars | ProCite | Reference Manager | RefWorks
Send citation to:


BibTeX | RIS | EndNote | Medlars | ProCite | Reference Manager | RefWorks
Send citation to:
Psychometric Properties of the Persian Version of the Gerontopole Frailty Screening Tool in the Elderly. 3 https://doi.org/10.58209/hehp.13.4.679
URL: http://daneshafarand.org/article-1-82982-en.html
URL: http://daneshafarand.org/article-1-82982-en.html
| Abstract (HTML) (531 Views)
Full-Text: (27 Views)
Introduction
According to the World Health Organization (WHO), advances in medical science have helped more people live longer. It is expected that the number of people aged over 60 will double by 2050, rising from 900 million in 2015 to about 2 billion in 2050, which will require fundamental social changes [1]. The WHO has predicted that by 2050, 80% of the elderly will live in low- and middle-income countries [2]. Based on the WHO report in 2015, about 10% of Iran’s population is over 60 years old, while this number will increase to 23% in the next 35 years [3].
Population aging has deep implications for planners and providers of health, medical, and social services. The most serious problem of an aging population is its vulnerability across different dimensions [4]. In old age, body systems experience a decrease in some of their homeostatic reserves, and if this decrease exceeds a threshold (about 30%), the regeneration mechanisms in the body cannot maintain homeostasis [5], leading to adverse health outcomes [6]. Frailty, as an age-related consequence, causes decreased performance across many physiological systems, collectively leading to vulnerability to sudden changes in health status due to small stressors [4]. Frailty occurs when there is a decrease in function not only in one system but in several physiological systems of the body, and the more physiological systems are impaired, the more likely frailty is. It can also lead to serious functional limitations and heightened sensitivity to adverse outcomes [5]. Frailty is a disturbance in mobility, balance, endurance, physical activity, muscle strength, nutrition, and cognition; in other words, it is a pervasive aging syndrome. Other syndromes (such as falls, delirium, functional decline, or bedsores) can lead to frailty, and frailty itself can lead to additional risk factors that, in turn, lead to disability, dependency, and death even more than other geriatric syndromes [7].
Frailty is prevalent among the elderly [8], ranging from 16% in those aged over 65 years to 52% in those aged over 85 years [9]. Assuming that by 2050 there will be 1.5 billion people worldwide aged 65 years and older, the next 30 years will see 148.5 million of the world’s elderly with frailty [10]. In a cohort study in Japan, the frailty rate among those without frailty at baseline increased to 7.7% after 4 years of follow-up; the death rate also increased, and the baseline state of frailty progressed from healthy to pre-frailty and later to frailty [11]. Not identifying and consequently not treating frailty means delaying possible interventions, potentially leading to an irreversible process toward disability [12]. Therefore, early identification of community-dwelling elderly with frailty is very important to implement preventive strategies against adverse health-related consequences, especially for preventing disability [8]. Thus, it is necessary to take adequate measures as soon as the first signs and symptoms of frailty appear [12], and frailty should be recognized as a health priority [13].
Providing appropriate screening tools is the first step to detect frailty in primary health care. Tools suitable for use at the initial level of care for the elderly and that can also be implemented by professionals include the Gerontopole Frailty Screening Tool (GFST), FiND, PRISMA-7, and Groningen Frailty Index (if adapted). In the FiND questionnaire, the disability dimension is examined along with three other signs of frailty; however, it was not used due to not considering all dimensions of frailty, as well as the limitation in implementing the 400-meter walking item. The PRISMA-7 tool only examines the disability dimension and does not consider other dimensions of frailty syndrome. The Groningen Frailty Index is a 15-item questionnaire that evaluates physical, cognitive, social, and psychosocial dimensions, which has more questions and takes longer to complete compared with other tools [14]. However, this tool has less diagnostic accuracy than other frailty screening tools [15], so it was not used. Finally, the GFST is a tool that considers all major symptoms of frailty and all dimensions of this syndrome. This tool can be completed by the general practitioner at the primary level of care, enabling the practitioner to quickly assess the frailty of the person. In addition, GFST, if adapted, can be implemented by an expert and even by the elderly themselves. The short time to complete the tool and its applicability in community-dwelling elderly are other advantages of this tool [16].
The concept of frailty screening in Iran is relatively new, and there is a need for a short, easy-to-use tool that can be readily implemented at the primary care level and completed quickly, and that can screen elderly people for frailty and refer them for appropriate interventions to prevent disability. Based on research conducted in Iran, no suitable tool has been found for this purpose, and frailty screening for the elderly is not performed at the primary care level. Training primary-care physicians and staff to provide services to the elderly and to perform frailty screening with appropriate tools can increase efficiency, and the resulting benefits will also benefit the elderly. Based on investigations and positive results in countries that have evaluated the validity and reliability of GFST, the research team decided to study the psychometric properties of the GFST in the elderly living in Tehran.
Instrument and Methods
Study design and Participants
This cross-sectional study, adhered to the STROBE guidelines [17], assessed the psychometric properties of the Persian version of GFST in Iranian elderly in 2020.
The inclusion criteria were age 60 years and older, ability to communicate and answer questionnaire questions, absence of disability (as assessed by the ADL questionnaire), and absence of acute clinical conditions. The elderly who did not wish to continue cooperating in the study were excluded. Stratified cluster sampling was conducted among the elderly referring to health care centers affiliated with Shahid Beheshti University of Medical Sciences. To this end, three clusters were randomly selected from the three health centers of North, East, and Shemiranat. The number of selected samples in each cluster ranged from 23 to 24 people. The sample size required to determine the sensitivity and specificity of the tool was calculated to be 194, based on 5% type I error, 80% power, and a minimum area under the receiver operating characteristic (ROC) curve of 0.60, using easyROC version 1.3.1 software. Taking into account a dropout rate of 10%, 214 samples were considered. It should be noted that initially, the Activities of Daily Living Questionnaire (ADLQ) was administered to the elderly. A score lower than 12 in this tool indicates functional impairment in basic activities of daily life, which signals disability and prevents the person from entering the study.
Instrument
Seven questionnaires were used. The first part was the standard questionnaire for assessing activities of daily living (ADL) of the elderly (ADLQ); the second part included demographic characteristics. The third part was the Stanford Health Assessment Questionnaire 8-Item Disability Index (HAQ 8-item), the fourth part was Abbreviated Mental Test (AMT) questions to check the cognitive status, and the fifth part was Mini Nutritional Assessment (MNA) questions to check the nutritional status. The sixth part of the questions included the Geriatric Depression Scale (GDS) and MNA, with GDS, AMTs, and HAQ 8-item DI as the gold standard, and the seventh part of the questions was related to the GFST.
In the first part, the standard ADLQ was used. The 8-item version of the ADLQ included items on personal hygiene, eating, dressing, moving, walking, bathing, continence (urine and feces), and toilet use. Each item had three options: dependent (0 points), needing help (1 point), and independent (2 points). The minimum and maximum scores ranged from 0 to 16. Each subject’s overall ADL score placed them into one of three categories: dependent (0–7 points), needing help (8–11 points), and independent (12–16 points). This tool has been validated and is reliable [18].
The second part of the questionnaire included demographic information, such as age, gender, level of education, and marital status.
The third part included assessing the individual’s disability status using the HAQ 8-item. This tool was psychometrically tested in 2014 [19]. It comprises 8 questions, including dressing, getting in and out of bed, lifting a full glass or cup to the mouth, walking on a flat surface outdoors, washing and drying the whole body, bending down and picking up clothes from the floor, opening and closing water taps, and getting in and out of the car. Each question was scored from 0 to 3 depending on the person’s ability: 0 if the activity was performed without problems, 1 with some difficulty, 2 with great difficulty, and 3 if the individual was not able to perform the activity and did it with the help of people or aids.
The fourth part included the assessment of cognitive status using AMT questions. This test was psychometrically validated [20]. The questions included: “How old are you?”, “What time of day is it now?”, “What year is this year?”, “What is the name of this place?”, “The occupation or family relationship of two of your companions or employees,” “What year were you born?”, “What year did the Islamic revolution take place?”, “Who is the leader of the country?”, “Count backwards one by one from 20,” and “Repeat the address of Pirozi Street No. 42.” In this questionnaire, a score of 7 or higher was considered dementia and less than 7 was normal.
In the fifth part, the MNA was used. This 18-item tool included anthropometric measurements (BMI, arm circumference, leg muscle circumference, and weight loss), dietary intake (number of meals, food and fluid intake, and anorexia), general assessment (lifestyle, medications, mobility, presence of acute stress, and the presence of dementia or depression), and personal evaluation (the person’s opinion about health and nutrition). If the person’s score was 12 or more, it was considered normal; if it was 11 or less, the evaluator was obliged to fill in the evaluation section for the person, then based on the final score, the person was classified into one of three groups, including 17-23/5 subject to malnutrition, less than 17 malnourished, and 24 and more appropriate nutritional status. This questionnaire was valid and reliable [21].
The sixth part was related to the questions of the GDS. Its 15- and 11-question forms were standardized by Malakouti et al. in 2015 [22]. The 11-question form showed a higher correlation with depression symptoms than the 15-question form. The questions were answered with ‘Yes’ and ‘No’. A ‘No’ answer had zero points and a ‘Yes’ answer had one point. A score of 6 or more in the 11-question form indicated depression. Depression is one of the dimensions of frailty syndrome, so the GDS tool was used to check its correlation.
The seventh part included questions related to GFST. This tool was designed to screen for frailty in the elderly presenting at the primary care level, which was completed by a general practitioner. It was presented in 8 items and introduced it as a standard tool. Its six questions included living alone, unwanted weight loss, memory complaints, fatigue, difficulty moving, and slow movement speed (walking a distance of 4 meters in more than 4 seconds). The two final questions, which had to be completed by a general practitioner, included subjective perception of the doctor in diagnosing whether a person is disabled or not, or needs to be referred to a geriatric specialist or a frailty clinic. If none of the questions were answered positively, the person would be healthy; if 1 to 2 questions were answered positively, the person would be in the pre-frail stage; and if three or more questions were answered positively, the person would be considered in the frailty stage [8].
Procedure
All methods were performed in accordance with the relevant guidelines and regulations and with the Declaration of Helsinki, including obtaining informed consent from the research participants before starting to fill in the questionnaires. Then, the questionnaires were completed in the health centers and for the referred elderly. First, written permission to use the GFST was obtained from its designer via email. The forward translation process was used, and two English-to-Persian translators (one specializing in geriatrics and another translator) were invited to translate the GFST into Persian. Separate English-to-Persian translations were prepared by these two translators. Then a group of experts, including some of the authors of this study, reviewed these two Persian translations of the GFST and incorporated their opinions. In the last step, a Persian-to-English translator translated the GFST back into English, and the accuracy of the translation was confirmed by a committee of experts [23]. After that, the translated English version was sent to the tool designer and approved by him. It should be noted that all steps of this process were conducted according to the WHO protocol for forward and backward translation techniques [24].
Face validity was evaluated qualitatively and quantitatively. In the qualitative approach, 11 elderly aged 60 years and older in Tehran were interviewed face-to-face to assess the clarity and comprehension of the questions, and their opinions were solicited. In the quantitative approach, the same 11 eligible elderly people were asked to evaluate the scale items for appropriateness using a five-point Likert scale (5=completely appropriate, 4=appropriate, 3=almost appropriate, 2=less appropriate, 1=not suitable at all). The impact score was calculated as Impact Score=frequency (percentage)×proportion, and a score greater than 1.5 was considered acceptable [25]. For evaluating content validity qualitatively, 11 experts were asked to provide written feedback on grammar, wording, item placement, and scoring after carefully studying the tool. Content validity index (CVI) and content validity ratio (CVR) were used to quantitatively measure content validity. In this method, 11 experts were asked to rate the importance and relevance of each item. The panel of experts included specialists in gerontology, geriatric health, and general medicine.
Because each item of the questionnaire measures an aspect of a complex clinical phenomenon (such as the Apgar score), it was not necessary to calculate internal correlations or subsequently perform construct validity (factor analysis) [26, 27]. Convergent validity was used to determine construct validity. Convergent validity assesses the correlation between GFST and other instruments designed to measure the same construct [28]. First, normality of the data was assessed using the Kolmogorov-Smirnov test, and the results indicated that the data did not follow a normal distribution. Therefore, to determine convergent validity between GFST and MNA, AMTs, GDS, and the HAQ 8-item, Spearman’s correlation was used, with a significance level of p<0.05. The method of known-groups comparison was also used. This type of validity indicates the ability of a tool to differentiate respondents according to a predefined criterion and hypothesis [29]. Age served as the known-groups parameter. It was expected that older individuals would have higher frailty than younger ones. Accordingly, the elderly were divided into two age groups, 60-69 years and 70 years and older, and comparisons were made between these two groups. The Mann-Whitney test was used to assess known-groups validity.
Studies have shown that frailty leads to disability [10, 30]. It has also been shown that the likelihood of frailty increases with age [5, 31]. To calculate the sensitivity and specificity of the GFST, each question of this questionnaire, which measures one dimension of frailty syndrome, was compared with the screening tool related to the same dimension, including (GFST loneliness item with GDS reference tool), (GFST unwanted weight loss item with MNA reference tool), (GFST feeling of fatigue item with GDS reference tool), (GFST movement difficulty item and slow walking item with HAQ 8-item reference tool), and (GFST memory complaint item with AMTs reference tool). Also, sensitivity and specificity for overall GFST results were calculated with standard tools (GDS, MNA, GDS, AMTs, and HAQ 8-item).
To check the reliability, inter-rater reliability was calculated. For this purpose, GFST was completed by two raters (one doctor and one expert) for 20 elderly. Each of the raters completed this tool individually without knowing the other rater. These elderly were not included in the main sample. Also, the correlation between the raters was calculated using the Kappa coefficient. Values greater than 0.7 of this index indicated acceptable agreement between two raters [28].
Data analysis
Data analysis was done using SPSS 16. Cronbach’s alpha was used to check internal consistency. A zero value of this index indicates unreliability of the scale due to measurement error. An alpha value greater than 0.7 shows good reliability for a scale. In the present study, Cronbach’s alpha coefficient was separately calculated for both raters (doctor and expert).
Findings
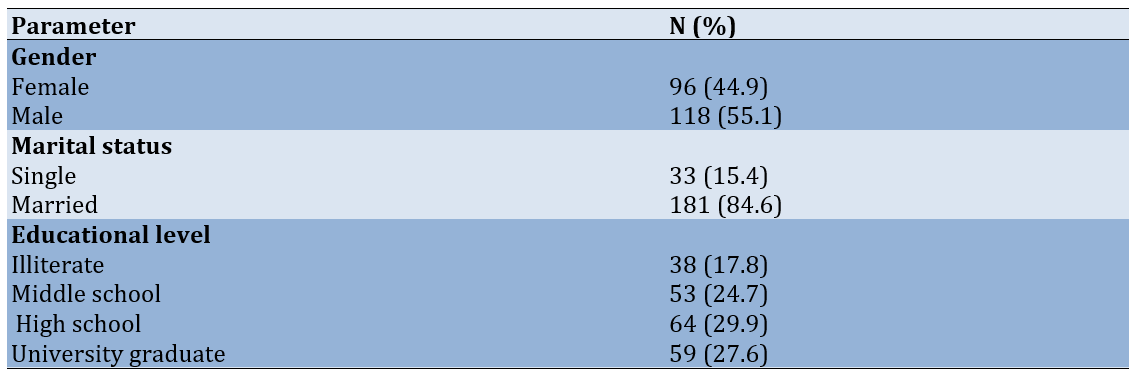
A total of 214 elderly, including 96 women and 118 men, with a mean age of 69.7±26.9 years were assessed (Table 1).
Table 1. Personal characteristics of the study participants (n=214)
The qualitative face validity of the opinions of the elderly regarding the GFST was solicited, and all the elderly stated that they understood the questions completely and that the questions were clear. The impact factor of all questions on the scale was greater than 1.5, and no question needed modification for quantitative face validity. Regarding qualitative content validity, experts stated that the questions were expressive and clear after careful study of the tool. The tool CVI for relevance was 0.95, clarity 0.93, and simplicity 0.93. The lowest CVR was estimated at 0.63 and the highest value was 1. Therefore, all the questions were kept and no questions were deleted.
The convergent validity of the GFST was established through its positive and significant correlation with the Stafford, AMT, MNA, and GDS (p<0.05). Additionally, known-group validity was supported based on age, as a significant positive relationship was found between age and frailty among the elderly. Moreover, concurrent criterion validity values between GFST and Stafford Scale, AMT, MNA, and GDS indicated the existence of a positive and significant correlation between the tools (p=0.05; Table 2).
Table 2. Concurrent criterion validity between the GFST with MNA, GDS, AMTs and HAQ 8-item using the Spearman correlation coefficient

The sensitivity and specificity for the first item (loneliness) of the Persian version of the GFST, with the results of the GDS, were 2.4% and 90%, respectively. For the second item of the Persian version of the GFST (unwanted weight loss), using the results of the MNA, the sensitivity and specificity were 50% and 96.6%, respectively. The sensitivity and specificity for the third GFST item (feeling of fatigue in the elderly) as estimated against the GDS were 91.7% and 58.4%, respectively. For the fourth GFST item (movement difficulty) with the HAQ 8-item as the reference tool, the sensitivity was 82.7% and the specificity 86.4%. For the fifth GFST item (memory status) in the Persian version of the GFST, with the AMT reference tool, sensitivity was 52.2% and specificity was 85.9%. The sensitivity and specificity values for the sixth GFST item (slow walking), using the HAQ 8-item as the reference tool, were 63.5% and 93.8%, respectively. The lowest sensitivity was 66.7% and the highest was 100%. The minimum and maximum specificity values were 63.1% and 74.7%, respectively (Table 3).
Table 3. Sensitivity and specificity of the Gerontopole Frailty Screening Tool (GFST) with standard tools

To determine the levels of sensitivity and specificity, we first defined frailty, and then calculated the corresponding sensitivity and specificity values. Frailty was defined as a positive result on the HAQ 8-item (i.e., those diagnosed as disabled by this criterion) and age of 75 years or older. The cut point and the corresponding sensitivity and specificity values were determined via the ROC curve. The ROC results indicated that at cut point 3, sensitivity and specificity were 75% and 65.8%, respectively. The area under the ROC curve was 0.758. The Kappa coefficient between the two raters was 0.826, indicating very favorable agreement. The Cronbach’s alpha for the Persian GFST dimensions completed by the doctor and by the expert were 0.757 and 0.797, respectively.
Discussion
This study aimed to translate and determine the psychometric properties of the GFST in the elderly in Tehran. The translation of GFST, which included 8 questions, was translated from English to Persian, and its psychometric properties were investigated. Producing accurate translations of reliable tools into different languages makes it possible for populations with different cultures to participate in studies; these studies will be scientifically comparable. Moreover, measurement tools will not yield reliable findings without an appropriate translation process followed by psychometric evaluation, in cross-cultural studies and in implementation [32].
Various psychometric properties of the mentioned tool, including face validity, content validity, concurrent validity, construct validity, and internal consistency and reliability, were investigated. In the CVI of the Persian version of the GFST, the mean level of agreement for relevance, clarity, and simplicity of expressions required for content validity was confirmed to a significant extent. Therefore, the Persian version of GFST had adequate content validity. Ceylan et al., who conducted validity and reliability of this scale in Turkey, reported that this tool has good content validity [33].
The concurrent validity of the correlation between the Persian version of the GFST and the criterion tools was favorable. In Cherubini et al.'s study, which included 9 European countries, Fried’s criterion is used as the criterion standard, and they report an overall agreement between the GFST and Fried’s criterion [8]. At the time of conducting this research in 2019, no valid and reliable tool was found in the field of frailty measurement. Therefore, MNA, GDS, AMT, and HAQ 8-item were used as reference tools. These questionnaires are standard tools that have been psychometrically evaluated in Iran and have been widely used in elderly studies. Thus, these tools were used as reference tools, and the agreement between GFST and the reference tools was measured. In Yaman & Ünal’s study in Turkey, CSHA’s clinical frailty scale is used as the reference standard for PRISMA 7, with the area under the ROC curve of 0.903 to validate PRISMA 7 in the elderly [13]. Also, Esenkaya conducted a study aiming to determine the validity of KCL in Turkey. They used Fried’s criterion as the gold standard, and the area under the ROC curve is 0.855 for frailty [34].
Convergent validity between the GFST and other tools was shown to be optimal, estimated in the range of 0.214 to 0.519. In Rosas et al.’s study, the convergent validity for the Frail Scale and Fried’s criterion is reported as 0.63 [35]. In Peters et al.’s study, which aimed to investigate the construct validity, reliability, and feasibility of the Groningen Frailty Index in the Netherlands, the convergent validity between the Groningen tool and each of the items related to diseases and disorders, life satisfaction, quality of life (SF-36), ADL (Katz), and mental health (EQ-5D) is reported as 0.45-0.61 [36].
Regarding known-groups validity, the aim was to compare the mean level of frailty in different age groups of the elderly, with the assumption that frailty increases with age, which was confirmed. In Rosas et al.’s study, the known-groups validity by comparing the frequency of frailty between age groups showed that frailty increases with age [35]. Peters et al. conducted a study to measure the psychometric properties of the Groningen Frailty Index. They investigated the known-groups validity for demographic characteristics, diseases, disorders, age, and female gender, and it has a significant relationship with all items except gender [36].
To assess the sensitivity and specificity of each question, it was measured against the reference tool, with favorable values for all questions except the first, which concerns “living alone for the elderly,” for which the sensitivity was 4.2%. This may be due to the item not being evaluated with a tool that measures social isolation, and its sensitivity and specificity were measured only with the depression questionnaire. To determine sensitivity and specificity, a definition of frailty was provided, and based on this, the sensitivity and specificity were 75% and 65.3%, respectively. In Cherubini et al.’s study, the sensitivity is 71% and the specificity 70.2% [8], which aligns with our results.
The internal consistency of the Persian version of the GFST was calculated by determining the Cronbach’s alpha coefficient. Cronbach’s alpha was calculated for both the doctor and the expert, and both values were favorable. The coefficient was 0.757 for the doctor and 0.779 for the expert; in both cases, it exceeded 0.7, indicating good internal consistency of the Persian GFST. In the study by Aygör et al., aiming to confirm the validity of the Edmonton Frailty Scale, internal consistency is also calculated via Cronbach’s alpha, and the coefficient is reported as 0.75 for the Edmonton tool [37].
The Cohen’s Kappa coefficient was used to determine agreement between two raters. The coefficient for each item was reported as very favorable. The Kappa for each item ranged from 0.7 to 1. The overall Kappa for the Persian GFST was 82.6%, indicating high agreement between the doctor and the expert in completing the Persian GFST. As mentioned earlier, this tool is completed by a doctor and can also be implemented by an expert, if adapted for use at the primary care level. This can accelerate service provision to the elderly and improve screening in crowded centers or where access to a doctor is limited. In the study by Aygör et al., the Kappa coefficient is calculated between 0.95 and 1 to assess test-retest agreement [37].
One limitation was the absence of a standard tool in the field of frailty that could serve as a reference tool. Therefore, to assess agreement, other similar tools were used. Another limitation was not using a specific questionnaire for the social dimension related to the first GFST item. To avoid increasing the number of questions and reducing elderly participation, the GDS questionnaire was used. Another limitation was the COVID-19 pandemic, during which many elderly people did not visit comprehensive health centers or were unwilling to participate, making recruitment more challenging. A smaller number of elderly aged 80 years and older participated in the study. Moreover, due to restrictions on students’ presence at comprehensive health centers, the pandemic prolonged the research timeline.
Conclusion
The Persian version of the Gerontopole Frailty Screening Tool is a valid and reliable instrument to determine frailty in Iranian elderly at the level of primary care.
Acknowledgments: The authors would like to thank all the elderly who participated in this study.
Ethical Permissions: This study was reviewed and approved by the School of Health and Safety, Shahid Beheshti University of Medical Sciences (code IR. SBMU.PHNS. REC.13958.108).
Conflicts of Interests: The authors declared no competing interests.
Authors' Contribution: Yousefi Z (First Author), Introduction Writer/Methodologist/Main Researcher (35%); Kavousi A (Second Author), Methodologist/Statistical Analyst (20%); Yarmohammadi S (Third Author), Introduction Writer/Methodologist (15%); Marashi T (Fourth Author), Methodologist/Statistical Analyst/Discussion Writer (30%)
Funding/Support: This study was funded by a research grant from the School of Health and Safety of Shahid Beheshti University of Medical Sciences. The funding body (SBMU) did not have any role in the design of the study, the collection, analysis, and interpretation of data, or in writing the manuscript.
According to the World Health Organization (WHO), advances in medical science have helped more people live longer. It is expected that the number of people aged over 60 will double by 2050, rising from 900 million in 2015 to about 2 billion in 2050, which will require fundamental social changes [1]. The WHO has predicted that by 2050, 80% of the elderly will live in low- and middle-income countries [2]. Based on the WHO report in 2015, about 10% of Iran’s population is over 60 years old, while this number will increase to 23% in the next 35 years [3].
Population aging has deep implications for planners and providers of health, medical, and social services. The most serious problem of an aging population is its vulnerability across different dimensions [4]. In old age, body systems experience a decrease in some of their homeostatic reserves, and if this decrease exceeds a threshold (about 30%), the regeneration mechanisms in the body cannot maintain homeostasis [5], leading to adverse health outcomes [6]. Frailty, as an age-related consequence, causes decreased performance across many physiological systems, collectively leading to vulnerability to sudden changes in health status due to small stressors [4]. Frailty occurs when there is a decrease in function not only in one system but in several physiological systems of the body, and the more physiological systems are impaired, the more likely frailty is. It can also lead to serious functional limitations and heightened sensitivity to adverse outcomes [5]. Frailty is a disturbance in mobility, balance, endurance, physical activity, muscle strength, nutrition, and cognition; in other words, it is a pervasive aging syndrome. Other syndromes (such as falls, delirium, functional decline, or bedsores) can lead to frailty, and frailty itself can lead to additional risk factors that, in turn, lead to disability, dependency, and death even more than other geriatric syndromes [7].
Frailty is prevalent among the elderly [8], ranging from 16% in those aged over 65 years to 52% in those aged over 85 years [9]. Assuming that by 2050 there will be 1.5 billion people worldwide aged 65 years and older, the next 30 years will see 148.5 million of the world’s elderly with frailty [10]. In a cohort study in Japan, the frailty rate among those without frailty at baseline increased to 7.7% after 4 years of follow-up; the death rate also increased, and the baseline state of frailty progressed from healthy to pre-frailty and later to frailty [11]. Not identifying and consequently not treating frailty means delaying possible interventions, potentially leading to an irreversible process toward disability [12]. Therefore, early identification of community-dwelling elderly with frailty is very important to implement preventive strategies against adverse health-related consequences, especially for preventing disability [8]. Thus, it is necessary to take adequate measures as soon as the first signs and symptoms of frailty appear [12], and frailty should be recognized as a health priority [13].
Providing appropriate screening tools is the first step to detect frailty in primary health care. Tools suitable for use at the initial level of care for the elderly and that can also be implemented by professionals include the Gerontopole Frailty Screening Tool (GFST), FiND, PRISMA-7, and Groningen Frailty Index (if adapted). In the FiND questionnaire, the disability dimension is examined along with three other signs of frailty; however, it was not used due to not considering all dimensions of frailty, as well as the limitation in implementing the 400-meter walking item. The PRISMA-7 tool only examines the disability dimension and does not consider other dimensions of frailty syndrome. The Groningen Frailty Index is a 15-item questionnaire that evaluates physical, cognitive, social, and psychosocial dimensions, which has more questions and takes longer to complete compared with other tools [14]. However, this tool has less diagnostic accuracy than other frailty screening tools [15], so it was not used. Finally, the GFST is a tool that considers all major symptoms of frailty and all dimensions of this syndrome. This tool can be completed by the general practitioner at the primary level of care, enabling the practitioner to quickly assess the frailty of the person. In addition, GFST, if adapted, can be implemented by an expert and even by the elderly themselves. The short time to complete the tool and its applicability in community-dwelling elderly are other advantages of this tool [16].
The concept of frailty screening in Iran is relatively new, and there is a need for a short, easy-to-use tool that can be readily implemented at the primary care level and completed quickly, and that can screen elderly people for frailty and refer them for appropriate interventions to prevent disability. Based on research conducted in Iran, no suitable tool has been found for this purpose, and frailty screening for the elderly is not performed at the primary care level. Training primary-care physicians and staff to provide services to the elderly and to perform frailty screening with appropriate tools can increase efficiency, and the resulting benefits will also benefit the elderly. Based on investigations and positive results in countries that have evaluated the validity and reliability of GFST, the research team decided to study the psychometric properties of the GFST in the elderly living in Tehran.
Instrument and Methods
Study design and Participants
This cross-sectional study, adhered to the STROBE guidelines [17], assessed the psychometric properties of the Persian version of GFST in Iranian elderly in 2020.
The inclusion criteria were age 60 years and older, ability to communicate and answer questionnaire questions, absence of disability (as assessed by the ADL questionnaire), and absence of acute clinical conditions. The elderly who did not wish to continue cooperating in the study were excluded. Stratified cluster sampling was conducted among the elderly referring to health care centers affiliated with Shahid Beheshti University of Medical Sciences. To this end, three clusters were randomly selected from the three health centers of North, East, and Shemiranat. The number of selected samples in each cluster ranged from 23 to 24 people. The sample size required to determine the sensitivity and specificity of the tool was calculated to be 194, based on 5% type I error, 80% power, and a minimum area under the receiver operating characteristic (ROC) curve of 0.60, using easyROC version 1.3.1 software. Taking into account a dropout rate of 10%, 214 samples were considered. It should be noted that initially, the Activities of Daily Living Questionnaire (ADLQ) was administered to the elderly. A score lower than 12 in this tool indicates functional impairment in basic activities of daily life, which signals disability and prevents the person from entering the study.
Instrument
Seven questionnaires were used. The first part was the standard questionnaire for assessing activities of daily living (ADL) of the elderly (ADLQ); the second part included demographic characteristics. The third part was the Stanford Health Assessment Questionnaire 8-Item Disability Index (HAQ 8-item), the fourth part was Abbreviated Mental Test (AMT) questions to check the cognitive status, and the fifth part was Mini Nutritional Assessment (MNA) questions to check the nutritional status. The sixth part of the questions included the Geriatric Depression Scale (GDS) and MNA, with GDS, AMTs, and HAQ 8-item DI as the gold standard, and the seventh part of the questions was related to the GFST.
In the first part, the standard ADLQ was used. The 8-item version of the ADLQ included items on personal hygiene, eating, dressing, moving, walking, bathing, continence (urine and feces), and toilet use. Each item had three options: dependent (0 points), needing help (1 point), and independent (2 points). The minimum and maximum scores ranged from 0 to 16. Each subject’s overall ADL score placed them into one of three categories: dependent (0–7 points), needing help (8–11 points), and independent (12–16 points). This tool has been validated and is reliable [18].
The second part of the questionnaire included demographic information, such as age, gender, level of education, and marital status.
The third part included assessing the individual’s disability status using the HAQ 8-item. This tool was psychometrically tested in 2014 [19]. It comprises 8 questions, including dressing, getting in and out of bed, lifting a full glass or cup to the mouth, walking on a flat surface outdoors, washing and drying the whole body, bending down and picking up clothes from the floor, opening and closing water taps, and getting in and out of the car. Each question was scored from 0 to 3 depending on the person’s ability: 0 if the activity was performed without problems, 1 with some difficulty, 2 with great difficulty, and 3 if the individual was not able to perform the activity and did it with the help of people or aids.
The fourth part included the assessment of cognitive status using AMT questions. This test was psychometrically validated [20]. The questions included: “How old are you?”, “What time of day is it now?”, “What year is this year?”, “What is the name of this place?”, “The occupation or family relationship of two of your companions or employees,” “What year were you born?”, “What year did the Islamic revolution take place?”, “Who is the leader of the country?”, “Count backwards one by one from 20,” and “Repeat the address of Pirozi Street No. 42.” In this questionnaire, a score of 7 or higher was considered dementia and less than 7 was normal.
In the fifth part, the MNA was used. This 18-item tool included anthropometric measurements (BMI, arm circumference, leg muscle circumference, and weight loss), dietary intake (number of meals, food and fluid intake, and anorexia), general assessment (lifestyle, medications, mobility, presence of acute stress, and the presence of dementia or depression), and personal evaluation (the person’s opinion about health and nutrition). If the person’s score was 12 or more, it was considered normal; if it was 11 or less, the evaluator was obliged to fill in the evaluation section for the person, then based on the final score, the person was classified into one of three groups, including 17-23/5 subject to malnutrition, less than 17 malnourished, and 24 and more appropriate nutritional status. This questionnaire was valid and reliable [21].
The sixth part was related to the questions of the GDS. Its 15- and 11-question forms were standardized by Malakouti et al. in 2015 [22]. The 11-question form showed a higher correlation with depression symptoms than the 15-question form. The questions were answered with ‘Yes’ and ‘No’. A ‘No’ answer had zero points and a ‘Yes’ answer had one point. A score of 6 or more in the 11-question form indicated depression. Depression is one of the dimensions of frailty syndrome, so the GDS tool was used to check its correlation.
The seventh part included questions related to GFST. This tool was designed to screen for frailty in the elderly presenting at the primary care level, which was completed by a general practitioner. It was presented in 8 items and introduced it as a standard tool. Its six questions included living alone, unwanted weight loss, memory complaints, fatigue, difficulty moving, and slow movement speed (walking a distance of 4 meters in more than 4 seconds). The two final questions, which had to be completed by a general practitioner, included subjective perception of the doctor in diagnosing whether a person is disabled or not, or needs to be referred to a geriatric specialist or a frailty clinic. If none of the questions were answered positively, the person would be healthy; if 1 to 2 questions were answered positively, the person would be in the pre-frail stage; and if three or more questions were answered positively, the person would be considered in the frailty stage [8].
Procedure
All methods were performed in accordance with the relevant guidelines and regulations and with the Declaration of Helsinki, including obtaining informed consent from the research participants before starting to fill in the questionnaires. Then, the questionnaires were completed in the health centers and for the referred elderly. First, written permission to use the GFST was obtained from its designer via email. The forward translation process was used, and two English-to-Persian translators (one specializing in geriatrics and another translator) were invited to translate the GFST into Persian. Separate English-to-Persian translations were prepared by these two translators. Then a group of experts, including some of the authors of this study, reviewed these two Persian translations of the GFST and incorporated their opinions. In the last step, a Persian-to-English translator translated the GFST back into English, and the accuracy of the translation was confirmed by a committee of experts [23]. After that, the translated English version was sent to the tool designer and approved by him. It should be noted that all steps of this process were conducted according to the WHO protocol for forward and backward translation techniques [24].
Face validity was evaluated qualitatively and quantitatively. In the qualitative approach, 11 elderly aged 60 years and older in Tehran were interviewed face-to-face to assess the clarity and comprehension of the questions, and their opinions were solicited. In the quantitative approach, the same 11 eligible elderly people were asked to evaluate the scale items for appropriateness using a five-point Likert scale (5=completely appropriate, 4=appropriate, 3=almost appropriate, 2=less appropriate, 1=not suitable at all). The impact score was calculated as Impact Score=frequency (percentage)×proportion, and a score greater than 1.5 was considered acceptable [25]. For evaluating content validity qualitatively, 11 experts were asked to provide written feedback on grammar, wording, item placement, and scoring after carefully studying the tool. Content validity index (CVI) and content validity ratio (CVR) were used to quantitatively measure content validity. In this method, 11 experts were asked to rate the importance and relevance of each item. The panel of experts included specialists in gerontology, geriatric health, and general medicine.
Because each item of the questionnaire measures an aspect of a complex clinical phenomenon (such as the Apgar score), it was not necessary to calculate internal correlations or subsequently perform construct validity (factor analysis) [26, 27]. Convergent validity was used to determine construct validity. Convergent validity assesses the correlation between GFST and other instruments designed to measure the same construct [28]. First, normality of the data was assessed using the Kolmogorov-Smirnov test, and the results indicated that the data did not follow a normal distribution. Therefore, to determine convergent validity between GFST and MNA, AMTs, GDS, and the HAQ 8-item, Spearman’s correlation was used, with a significance level of p<0.05. The method of known-groups comparison was also used. This type of validity indicates the ability of a tool to differentiate respondents according to a predefined criterion and hypothesis [29]. Age served as the known-groups parameter. It was expected that older individuals would have higher frailty than younger ones. Accordingly, the elderly were divided into two age groups, 60-69 years and 70 years and older, and comparisons were made between these two groups. The Mann-Whitney test was used to assess known-groups validity.
Studies have shown that frailty leads to disability [10, 30]. It has also been shown that the likelihood of frailty increases with age [5, 31]. To calculate the sensitivity and specificity of the GFST, each question of this questionnaire, which measures one dimension of frailty syndrome, was compared with the screening tool related to the same dimension, including (GFST loneliness item with GDS reference tool), (GFST unwanted weight loss item with MNA reference tool), (GFST feeling of fatigue item with GDS reference tool), (GFST movement difficulty item and slow walking item with HAQ 8-item reference tool), and (GFST memory complaint item with AMTs reference tool). Also, sensitivity and specificity for overall GFST results were calculated with standard tools (GDS, MNA, GDS, AMTs, and HAQ 8-item).
To check the reliability, inter-rater reliability was calculated. For this purpose, GFST was completed by two raters (one doctor and one expert) for 20 elderly. Each of the raters completed this tool individually without knowing the other rater. These elderly were not included in the main sample. Also, the correlation between the raters was calculated using the Kappa coefficient. Values greater than 0.7 of this index indicated acceptable agreement between two raters [28].
Data analysis
Data analysis was done using SPSS 16. Cronbach’s alpha was used to check internal consistency. A zero value of this index indicates unreliability of the scale due to measurement error. An alpha value greater than 0.7 shows good reliability for a scale. In the present study, Cronbach’s alpha coefficient was separately calculated for both raters (doctor and expert).
Findings
A total of 214 elderly, including 96 women and 118 men, with a mean age of 69.7±26.9 years were assessed (Table 1).
Table 1. Personal characteristics of the study participants (n=214)
The qualitative face validity of the opinions of the elderly regarding the GFST was solicited, and all the elderly stated that they understood the questions completely and that the questions were clear. The impact factor of all questions on the scale was greater than 1.5, and no question needed modification for quantitative face validity. Regarding qualitative content validity, experts stated that the questions were expressive and clear after careful study of the tool. The tool CVI for relevance was 0.95, clarity 0.93, and simplicity 0.93. The lowest CVR was estimated at 0.63 and the highest value was 1. Therefore, all the questions were kept and no questions were deleted.
The convergent validity of the GFST was established through its positive and significant correlation with the Stafford, AMT, MNA, and GDS (p<0.05). Additionally, known-group validity was supported based on age, as a significant positive relationship was found between age and frailty among the elderly. Moreover, concurrent criterion validity values between GFST and Stafford Scale, AMT, MNA, and GDS indicated the existence of a positive and significant correlation between the tools (p=0.05; Table 2).
Table 2. Concurrent criterion validity between the GFST with MNA, GDS, AMTs and HAQ 8-item using the Spearman correlation coefficient
The sensitivity and specificity for the first item (loneliness) of the Persian version of the GFST, with the results of the GDS, were 2.4% and 90%, respectively. For the second item of the Persian version of the GFST (unwanted weight loss), using the results of the MNA, the sensitivity and specificity were 50% and 96.6%, respectively. The sensitivity and specificity for the third GFST item (feeling of fatigue in the elderly) as estimated against the GDS were 91.7% and 58.4%, respectively. For the fourth GFST item (movement difficulty) with the HAQ 8-item as the reference tool, the sensitivity was 82.7% and the specificity 86.4%. For the fifth GFST item (memory status) in the Persian version of the GFST, with the AMT reference tool, sensitivity was 52.2% and specificity was 85.9%. The sensitivity and specificity values for the sixth GFST item (slow walking), using the HAQ 8-item as the reference tool, were 63.5% and 93.8%, respectively. The lowest sensitivity was 66.7% and the highest was 100%. The minimum and maximum specificity values were 63.1% and 74.7%, respectively (Table 3).
Table 3. Sensitivity and specificity of the Gerontopole Frailty Screening Tool (GFST) with standard tools
To determine the levels of sensitivity and specificity, we first defined frailty, and then calculated the corresponding sensitivity and specificity values. Frailty was defined as a positive result on the HAQ 8-item (i.e., those diagnosed as disabled by this criterion) and age of 75 years or older. The cut point and the corresponding sensitivity and specificity values were determined via the ROC curve. The ROC results indicated that at cut point 3, sensitivity and specificity were 75% and 65.8%, respectively. The area under the ROC curve was 0.758. The Kappa coefficient between the two raters was 0.826, indicating very favorable agreement. The Cronbach’s alpha for the Persian GFST dimensions completed by the doctor and by the expert were 0.757 and 0.797, respectively.
Discussion
This study aimed to translate and determine the psychometric properties of the GFST in the elderly in Tehran. The translation of GFST, which included 8 questions, was translated from English to Persian, and its psychometric properties were investigated. Producing accurate translations of reliable tools into different languages makes it possible for populations with different cultures to participate in studies; these studies will be scientifically comparable. Moreover, measurement tools will not yield reliable findings without an appropriate translation process followed by psychometric evaluation, in cross-cultural studies and in implementation [32].
Various psychometric properties of the mentioned tool, including face validity, content validity, concurrent validity, construct validity, and internal consistency and reliability, were investigated. In the CVI of the Persian version of the GFST, the mean level of agreement for relevance, clarity, and simplicity of expressions required for content validity was confirmed to a significant extent. Therefore, the Persian version of GFST had adequate content validity. Ceylan et al., who conducted validity and reliability of this scale in Turkey, reported that this tool has good content validity [33].
The concurrent validity of the correlation between the Persian version of the GFST and the criterion tools was favorable. In Cherubini et al.'s study, which included 9 European countries, Fried’s criterion is used as the criterion standard, and they report an overall agreement between the GFST and Fried’s criterion [8]. At the time of conducting this research in 2019, no valid and reliable tool was found in the field of frailty measurement. Therefore, MNA, GDS, AMT, and HAQ 8-item were used as reference tools. These questionnaires are standard tools that have been psychometrically evaluated in Iran and have been widely used in elderly studies. Thus, these tools were used as reference tools, and the agreement between GFST and the reference tools was measured. In Yaman & Ünal’s study in Turkey, CSHA’s clinical frailty scale is used as the reference standard for PRISMA 7, with the area under the ROC curve of 0.903 to validate PRISMA 7 in the elderly [13]. Also, Esenkaya conducted a study aiming to determine the validity of KCL in Turkey. They used Fried’s criterion as the gold standard, and the area under the ROC curve is 0.855 for frailty [34].
Convergent validity between the GFST and other tools was shown to be optimal, estimated in the range of 0.214 to 0.519. In Rosas et al.’s study, the convergent validity for the Frail Scale and Fried’s criterion is reported as 0.63 [35]. In Peters et al.’s study, which aimed to investigate the construct validity, reliability, and feasibility of the Groningen Frailty Index in the Netherlands, the convergent validity between the Groningen tool and each of the items related to diseases and disorders, life satisfaction, quality of life (SF-36), ADL (Katz), and mental health (EQ-5D) is reported as 0.45-0.61 [36].
Regarding known-groups validity, the aim was to compare the mean level of frailty in different age groups of the elderly, with the assumption that frailty increases with age, which was confirmed. In Rosas et al.’s study, the known-groups validity by comparing the frequency of frailty between age groups showed that frailty increases with age [35]. Peters et al. conducted a study to measure the psychometric properties of the Groningen Frailty Index. They investigated the known-groups validity for demographic characteristics, diseases, disorders, age, and female gender, and it has a significant relationship with all items except gender [36].
To assess the sensitivity and specificity of each question, it was measured against the reference tool, with favorable values for all questions except the first, which concerns “living alone for the elderly,” for which the sensitivity was 4.2%. This may be due to the item not being evaluated with a tool that measures social isolation, and its sensitivity and specificity were measured only with the depression questionnaire. To determine sensitivity and specificity, a definition of frailty was provided, and based on this, the sensitivity and specificity were 75% and 65.3%, respectively. In Cherubini et al.’s study, the sensitivity is 71% and the specificity 70.2% [8], which aligns with our results.
The internal consistency of the Persian version of the GFST was calculated by determining the Cronbach’s alpha coefficient. Cronbach’s alpha was calculated for both the doctor and the expert, and both values were favorable. The coefficient was 0.757 for the doctor and 0.779 for the expert; in both cases, it exceeded 0.7, indicating good internal consistency of the Persian GFST. In the study by Aygör et al., aiming to confirm the validity of the Edmonton Frailty Scale, internal consistency is also calculated via Cronbach’s alpha, and the coefficient is reported as 0.75 for the Edmonton tool [37].
The Cohen’s Kappa coefficient was used to determine agreement between two raters. The coefficient for each item was reported as very favorable. The Kappa for each item ranged from 0.7 to 1. The overall Kappa for the Persian GFST was 82.6%, indicating high agreement between the doctor and the expert in completing the Persian GFST. As mentioned earlier, this tool is completed by a doctor and can also be implemented by an expert, if adapted for use at the primary care level. This can accelerate service provision to the elderly and improve screening in crowded centers or where access to a doctor is limited. In the study by Aygör et al., the Kappa coefficient is calculated between 0.95 and 1 to assess test-retest agreement [37].
One limitation was the absence of a standard tool in the field of frailty that could serve as a reference tool. Therefore, to assess agreement, other similar tools were used. Another limitation was not using a specific questionnaire for the social dimension related to the first GFST item. To avoid increasing the number of questions and reducing elderly participation, the GDS questionnaire was used. Another limitation was the COVID-19 pandemic, during which many elderly people did not visit comprehensive health centers or were unwilling to participate, making recruitment more challenging. A smaller number of elderly aged 80 years and older participated in the study. Moreover, due to restrictions on students’ presence at comprehensive health centers, the pandemic prolonged the research timeline.
Conclusion
The Persian version of the Gerontopole Frailty Screening Tool is a valid and reliable instrument to determine frailty in Iranian elderly at the level of primary care.
Acknowledgments: The authors would like to thank all the elderly who participated in this study.
Ethical Permissions: This study was reviewed and approved by the School of Health and Safety, Shahid Beheshti University of Medical Sciences (code IR. SBMU.PHNS. REC.13958.108).
Conflicts of Interests: The authors declared no competing interests.
Authors' Contribution: Yousefi Z (First Author), Introduction Writer/Methodologist/Main Researcher (35%); Kavousi A (Second Author), Methodologist/Statistical Analyst (20%); Yarmohammadi S (Third Author), Introduction Writer/Methodologist (15%); Marashi T (Fourth Author), Methodologist/Statistical Analyst/Discussion Writer (30%)
Funding/Support: This study was funded by a research grant from the School of Health and Safety of Shahid Beheshti University of Medical Sciences. The funding body (SBMU) did not have any role in the design of the study, the collection, analysis, and interpretation of data, or in writing the manuscript.
| Rights and permissions | |
 |
This work is licensed under a Creative Commons Attribution-NonCommercial 4.0 International License. |